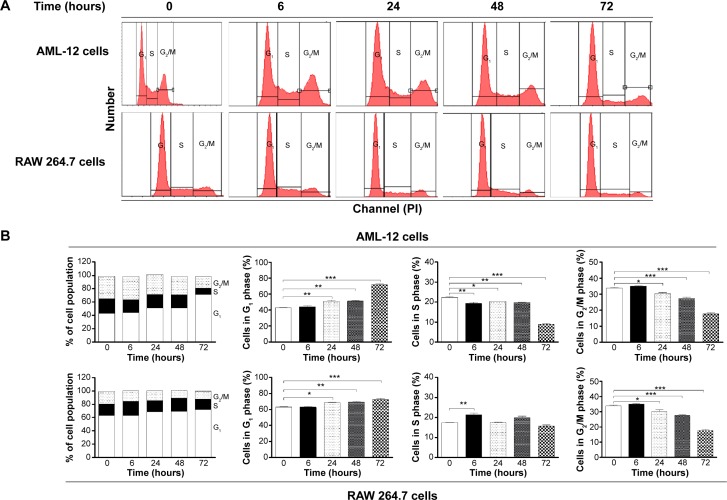
Figure 3.
Sch B induces cell cycle arrest in mouse AML-12 and RAW 264.7 cells in a time-dependent manner.
Notes: Cells were treated with Sch B at 25 μM for 6, 24, 48, and 72 hours and then subjected to flow cytometric analysis. The PI-stained DNA fluorescence intensity is shown in histogram overlay for cell cycle distribution over 72 hours in mouse AML-12 and RAW 264.7 cells (A). The flow cytometer collected 20,000 events for analysis. The bar graphs show the percentage of AML-12 and RAW 264.7 cells in G1, S, and G2/M phases (B). Data are the mean ± SEM of three independent experiments. *P<0.05; **P<0.01; and ***P<0.001 by one-way ANOVA.
Abbreviations: Sch B, schisandrin B; SEM, standard error of the mean; ANOVA, analysis of variance; PI, propidium iodide.

