Figure 6.
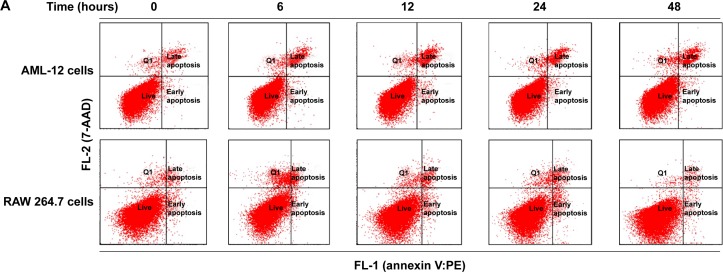
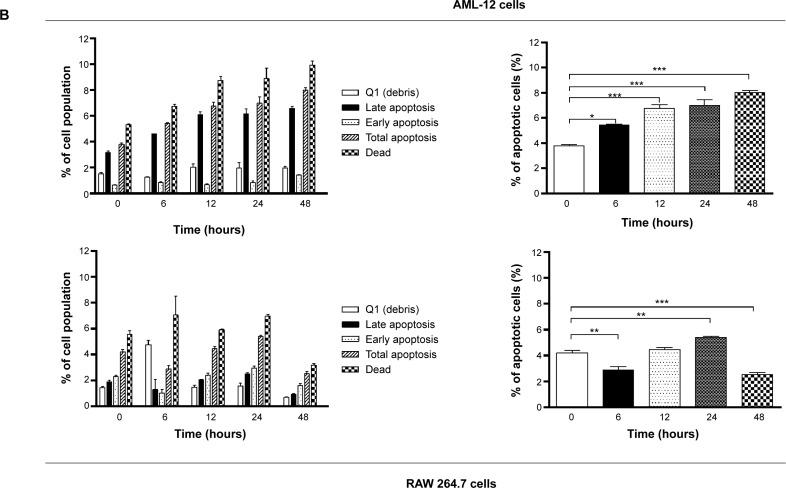
Sch B induces apoptotic cell death in mouse AML-12 and RAW 264.7 cells over 72 hours.
Notes: Flow cytometric plots of specific cell populations (live, early apoptosis, and late apoptosis) in mouse AML-12 and RAW 264.7 cells treated with Sch B at 25 μM for 6, 12, 24, and 48 hours (A). Bar graphs showing the percentage of apoptotic cells in AML-12 and RAW 264.7 cells treated with Sch B at 25 μM for 6, 12, 24, and 48 hours (B). Data are the mean ± SEM of three independent experiments. *P<0.05; **P<0.01; and ***P<0.001 by one-way ANOVA.
Abbreviations: Sch B, Schisandrin B; SEM, standard error of the mean; ANOVA, analysis of variance; PE, phycoerythrin; 7-AAD, 7-aminoactinomycin D; Q1, debris.


