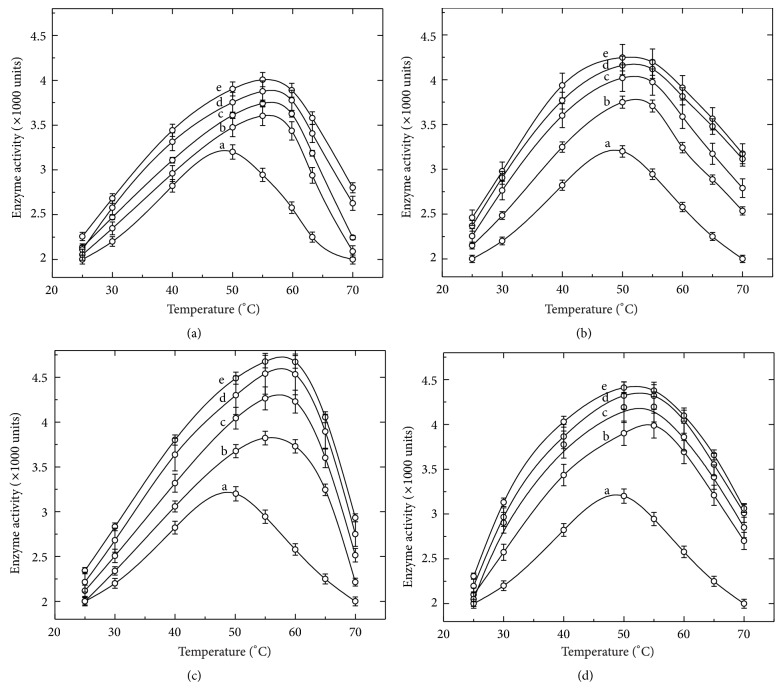
Figure 2.
Effect of cosolvents on activity and optimum temperature of α-amylase. Figures 2(a), 2(b), 2(c), and 2(d) represent the activity profiles of the enzyme in the presence of glycerol, sorbitol, sucrose, and trehalose, respectively. The activity of the enzyme was measured at different temperatures and curves represented as the enzyme (a) in buffer only, (b) in 10%, (c) in 20%, (d), in 30%, and (e) in 40% (w/v) of respective cosolvents.

