Figure 5.

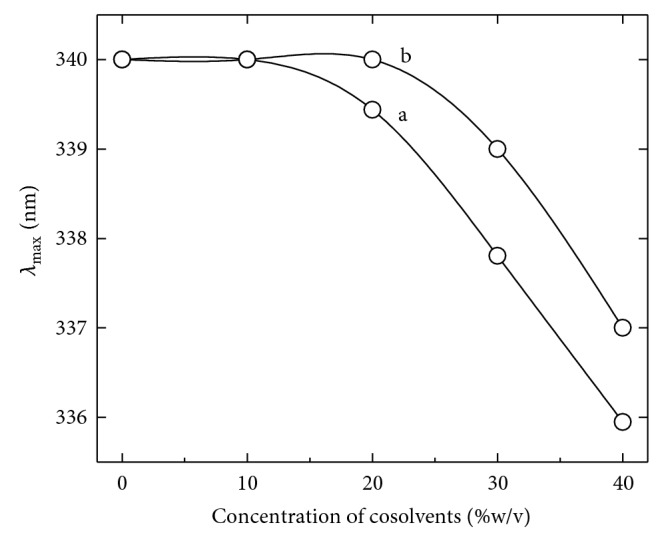
Effect of cosolvents on λ max of α-amylase. The curves represent the changes in emission maxima of the enzyme in the presence of different concentrations of sucrose (a) and sorbitol (b).

Effect of cosolvents on λ max of α-amylase. The curves represent the changes in emission maxima of the enzyme in the presence of different concentrations of sucrose (a) and sorbitol (b).