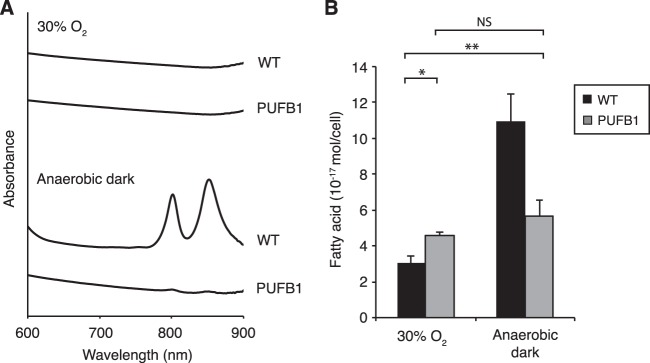
FIG 4.
Fatty acid and SC levels in the PUFB1 mutant. (A) Absorption spectra of wild-type (WT) and PUFB1 cells grown at 30% O2 tension (top) and anaerobically in the dark (bottom). (B) Fatty acid content of cells under the same conditions shown in panel A. Data represent the average from three biological replicates; error bars indicate standard deviation. ∗, P = 0.0025; ∗∗, P = 0.0035; NS, not significant.

