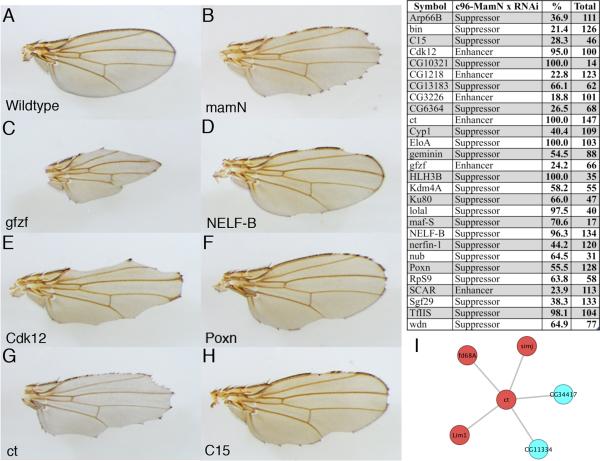
Figure 3. mastermind genetic screen.
(A) Wild type fly wing (B) dominant negative mam (c96-mamN) phenotype (C, E, G) enhancer phenotypes seen with loss of gfzf, Cdk12 and ct. (D, F, H) suppressor phenotypes seen with loss of NELF-B, Poxn, and C15. Note the presence of patches of wild type wing margin. (I) Interactions between previously identified mam modifiers and the Notch target gene, ct. Red nodes represent transcription factors.

