
Figure 7. Connecting the mastermind genetic network.
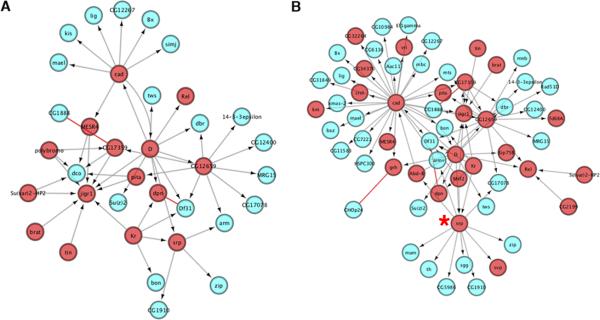
(A) Unsupervised network view of 35 mastermind modifiers. (B) Supervised network view of 62 mastermind modifiers. All nodes in interaction network are previously identified mastermind modifiers. Red nodes represent TFs. Blue nodes represent non-TF proteins. Red edges represent protein-protein interactions. Gray edges with arrows represent directional regulatory edges. The red asterisk indicates interactions related to serpent (srp).