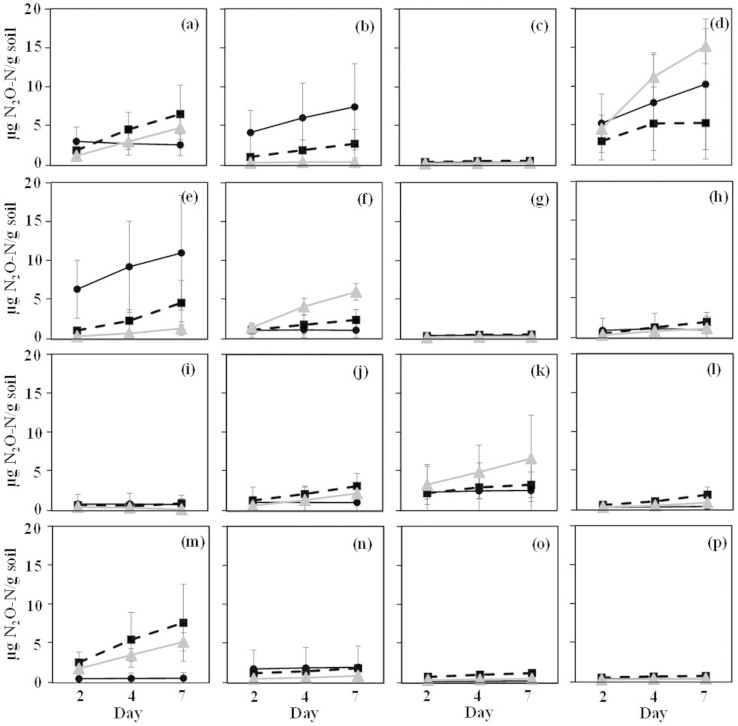
Figure 2. N2O production by 15 selected fungi strains inoculated in 3 different sterile soils.
NO2− was used as the electron acceptor. The strains were incubated for 7 days, and headspace N2O concentration were measured 3 times (2, 4 and 7 days after NO2− addition). Code for the soils: Black circle: Sweden (Slogaryd), forest soil; grey triangle: France, arable soil; black rectangle: The Netherlands, grassland soil. Code for the fungi: a: Trichoderma harzianum (MIAE00042); b: Fusarium verticillioides (MIAE00306); c: Penicillium adametzii (MIAE01008); d: F. oxysporum f. sp. lini (MIAE00347); e: F. dimerum (MIAE00598); f: Metarhizium anisopliae (MIAE00953); g: Chaetomium sp. (MIAE00985); h: T. harzianum (anamorph) (MIAE01011); i: Leptosphaeria sp. (MIAE01060); j: T. tomentosum (MIAE00031); k: Fusarium sp. (MIAE01519); l: Clonostachys candelabrum (MIAE00941); m: Phialocephala sp. (MIAE00968); n: Colletotrichum coccodes (MIAE01515); o: Aspergillus sp. (MIAE01518);); p: No fungi control. The error bar represents the standard deviation (n = 3).

