
Figure 1.
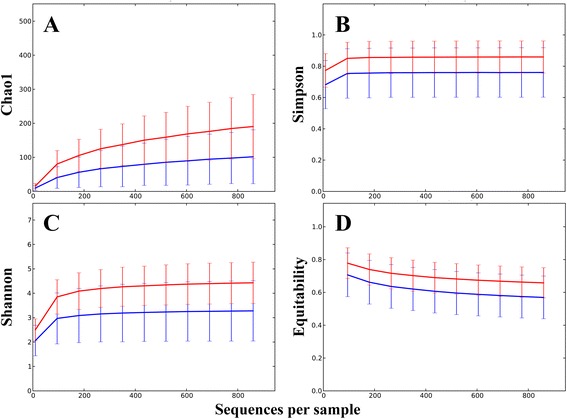
Alpha diversity is significantly different between fecal and cecal microbiota. Alpha diversity indicators of cecal (red) and fecal (blue) samples all showed significant (p < 1e−5) difference based on 1e5 Monte Carlo permutations. The indices plotted in the four panels are; A, Chao 1; B, Simpson; C, Shannon; and D, Equitability.