
Figure 2.
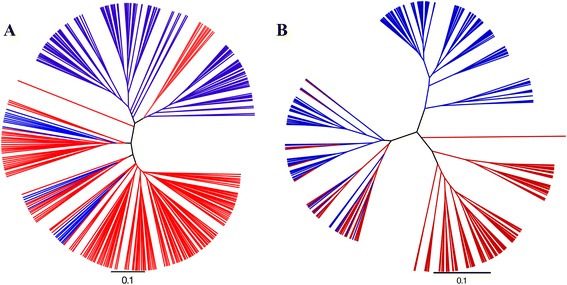
UniFrac distance shows microbiota differences between fecal and cecal origins. A tree representing cecal (red) and fecal (blue) samples. The sample clustering is based on jacknifed weighted (A) and unweighted (B) UniFrac. Tree files were generated in Qiime and visualised in FigTree. The two communities were significantly (p < 1e−5) different based on both weighted and unweighted UniFrac and ADONIS statistics using 1e5 permutations.