
Figure 3.
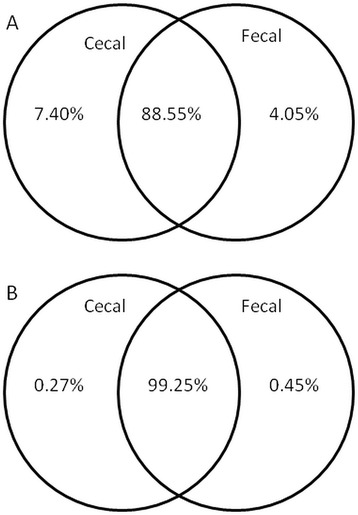
Venn diagrams showing percentage of shared OTUs. Diagrams are show the percentage of shared OTUs (A) and the percentage of sequence reads that they represented (B) of cecal and fecal origin at 3% divergence. 88.55% of all OTUs are shared between the sections and those OTUs represented 99.25% of all sequences.