
Figure 4.
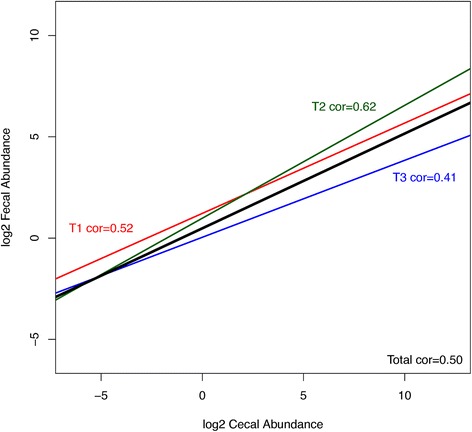
Correlations between cecal and fecal abundance. Line graph representing correlations between cecal and fecal abundance in trial 1 (red), trial 2 (green), trial 3 (blue) and complete set (black line). There is a reproducible positive correlation across the 3 trials. All individual OTUs present in both cecal and fecal sample for all 163 birds were used in calculation, however, due to a very high number they are not displayed in the plot.