
Figure 3.
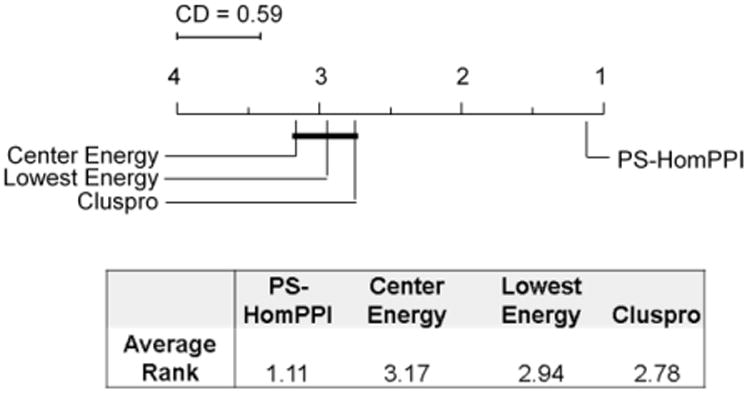
Pair-wise comparisons of different docking scoring methods using Nemenyi test. Methods that are not significantly different (at significant level α=0.05) are grouped together (via connecting lines). The average “rank” of each method over docking cases is shown in the table (and also on the x-axis of the plot).