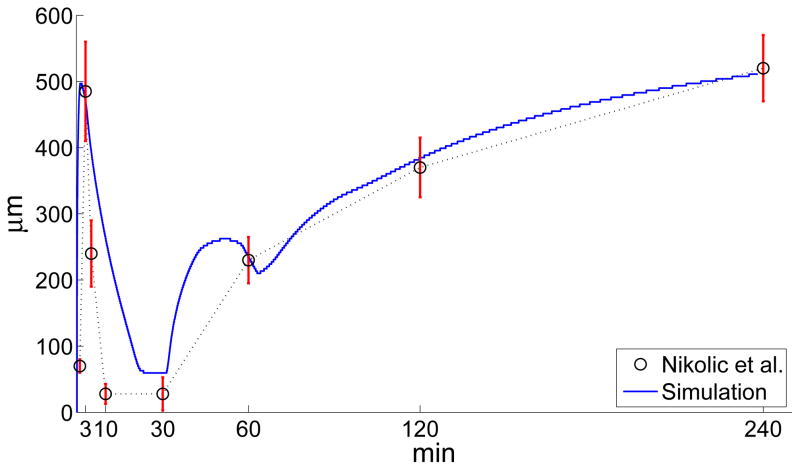
Figure 6.
Time evolution of the distance from the wound edge of the MAPK front. The circles and the intersecting vertical bars represent the average front position and one standard deviation error bars, respectively. Their values have been obtained from the experimental data in [20]. The solid trace has been obtained through a computer simulation of Eqns. (20)–(24) with dimensionless parameters: α = 0.35, η = 16, ν = 5, cA = 0.625, n = 6, γ = 2, pA = 0.975, m = 9, λ = 0.55, τ = 2.56. These parameters are based on kP = 5.6 × 10⁻³s−1, DL = 5.6 × 10⁻⁷cm2s−1, , gL = 0.54 × 10⁻²s−1, gP = 0.17 × 108cm−2s−1, R = 3.2 × 1011cm−2, , CA = 109cm−2, TD = 420s.

