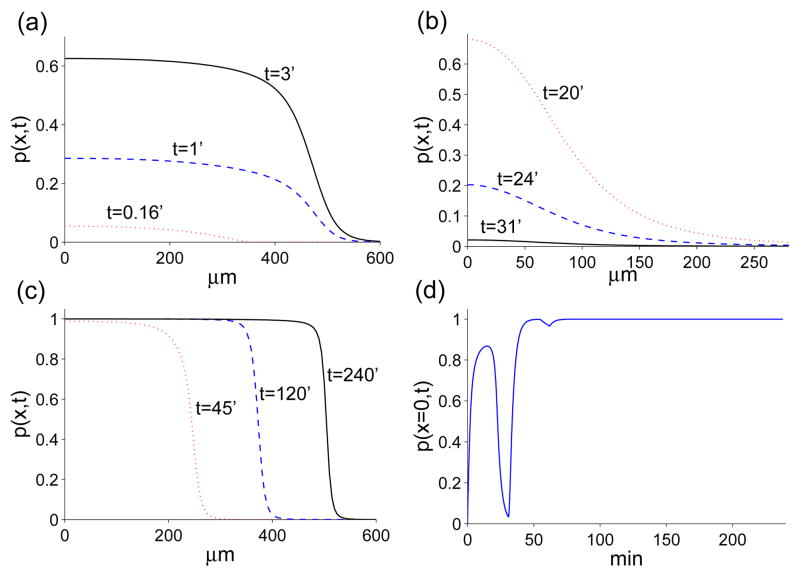
Figure 7.
Time evolution of protease. (a) after injury the fast diffusion of ROS drives MAPK activation. (b) as ROS diffuses away, the positive feedback loop between MAPK and ligand is not strong enough to sustain signaling and the depth of the front decreases. (c) once the cells start moving, ROS production and the ligand-protease feedback loop fuel the activation front. (d) time evolution of protease concentration at x = 0. The parameters used to obtain these plots are the same as the ones used to generate Fig. 6.

