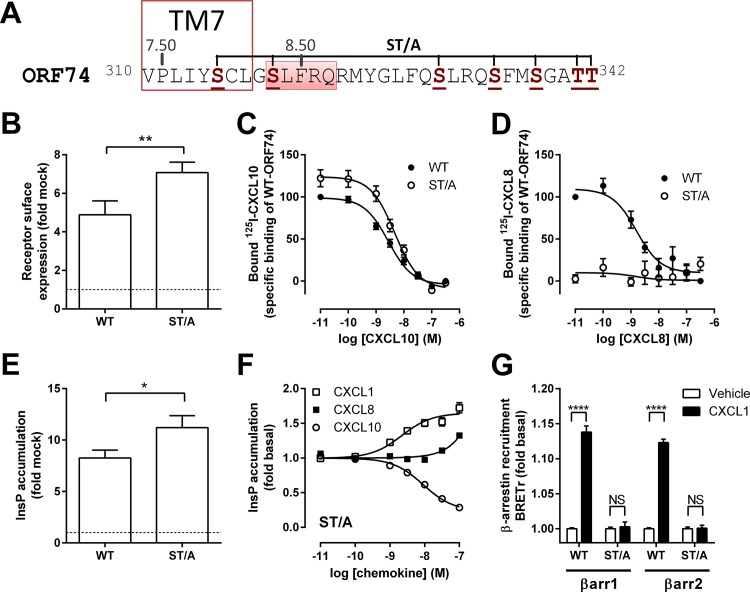
Fig 4. Characterization and β-arrestin recruitment to ORF74-ST/A.
(A) Schematic representation of the C-tail of ORF74, starting at the conserved VPxxY-motif in TM7. Serine and threonine residues mutated to alanine in ORF74-ST/A are shown in bold brown. The location of TM7 (delineated) and helix 8 (marked red) are based on the CCR5 crystal structure (PDB-code 4MBS) [35]. (B-F) HEK293T cells were transiently transfected with WT-ORF74 (WT) (B-E) or ORF74-ST/A (ST/A) (B-F) or empty vector DNA (mock-transfected) (B, E). (B) Relative receptor expression at the cell surface was determined by ELISA. Binding of 125I-CXCL10 (C) or 125I-CXCL8 (D) to intact HEK293T cells was measured in the presence of increasing concentrations unlabeled homologous chemokines. Constitutive (E) or chemokine-induced (F) activation of PLC was determined by measuring InsP accumulation. (G) HEK293T cells expressing ORF74-Rluc8 (WT) or ORF74-ST/A-Rluc8 (ST/A) in combination with β-arrestin1-eYFP (βarr1) or β-arrestin2-eYFP (βarr2) were vehicle-stimulated (white bars) or stimulated with 300 nM CXCL1 (black bars) before measurement of BRET. Data are presented as fold over mock-transfected cells (dotted line) (B, E), percentage of specific binding (C, D) or fold over basal (F, G). All data are represented as the mean of pooled data from at least three independent experiments each performed in triplicate and error bars indicate SEM values. Statistical differences of cell surface expression (B) or constitutive PLC activation (E) between WT-ORF74 and ORF74-ST/A or between vehicle- and corresponding CXCL1-treated cells (G) were determined by a Student t test (**** p ≤ 0.0001, ** p ≤ 0.01, * p ≤ 0.05). NS = not significant.

