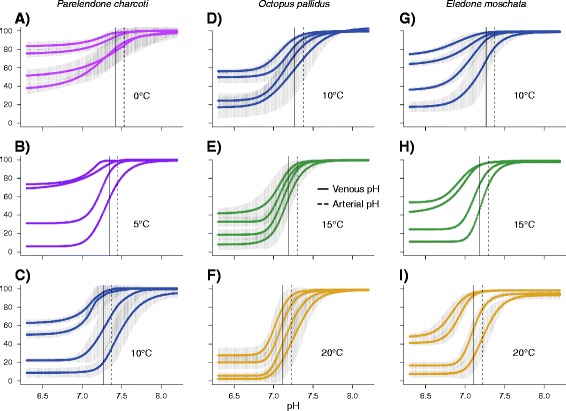
Figure 3.

pH oxygen-saturation curves of haemolymph from Antarctic (A-C), South-east Australian (D-F) and Mediterranean (G-I) octopods. pH oxygen-saturation curves denote the change of oxygen saturation of haemocyanin from high to low pH at constant PO2 (21, 13, 4, 1 kPa from left to right) and are most suitable to illustrate the high pH dependence of oxygen binding of cephalopod haemocyanin see [52]. For replicated measurements (n = 5–6), means and 95% confidence intervals (shaded area) of fitted pH oxygen-saturation curves are displayed. Replicate measurements could not be performed for Pareledone charcoti at 5°C and Eledone moschata at 15°C due to insufficient amounts of haemolymph sample. Vertical lines indicate the alpha-stat adjusted arterial (dashed) and venous pH (solid). The ten degree temperature windows cover approximate habitat temperatures for each species.
