Figure 5.

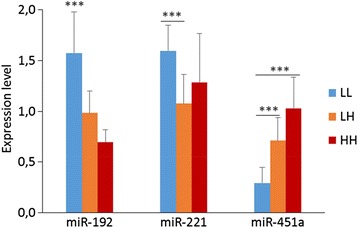
RT-qPCR result for selected miRNAs. Expression value were normalized against miR-122-5p. Vertical bars represent Standard Deviation (n = 7). *** stand for p < 0.001. For the detail descriptions of LL, LH, and HH see Methods.

RT-qPCR result for selected miRNAs. Expression value were normalized against miR-122-5p. Vertical bars represent Standard Deviation (n = 7). *** stand for p < 0.001. For the detail descriptions of LL, LH, and HH see Methods.