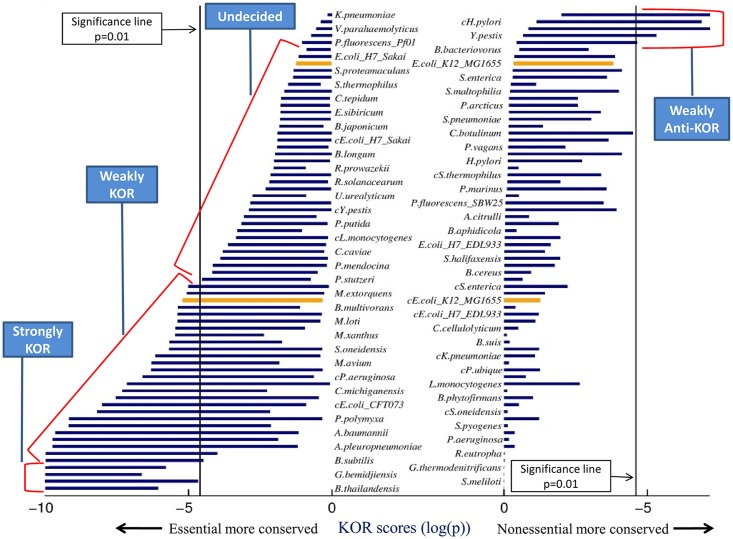
Fig 2. Bacteria model KOR scores across all possible media.
Each horizontal bar represents a KOR score interval—the minimum and maximum scores attained by the model across all possible media. Each model is represented by two bars, one on the left and one on the right (bacteria names are presented in two columns for readability only). The left column of bars shows KOR scores testing the hypothesis that the essential genes are differentially conserved, while the right column of bars shows the Anti-KOR scores, that is, testing the hypotheses that non-essential genes are differentially conserved. Models with left bars extending left of the (left) significance line have a medium under which they follow the KOR hypothesis, and analogously, models with right bars extending right of the (right) significance line have a medium under which they follow the anti-KOR hypothesis. Both E. coli models used in the study are shown in orange (upper one is SEED model). KOR Classes are marked by the blue text boxes. We did not find an organism whose essential genes were differentially conserved in some medium and his nonessential genes were differentially conserved in another medium—this can be seen as no bacterium has both its left and right bars crossing the significance lines.

