
Fig. 2.
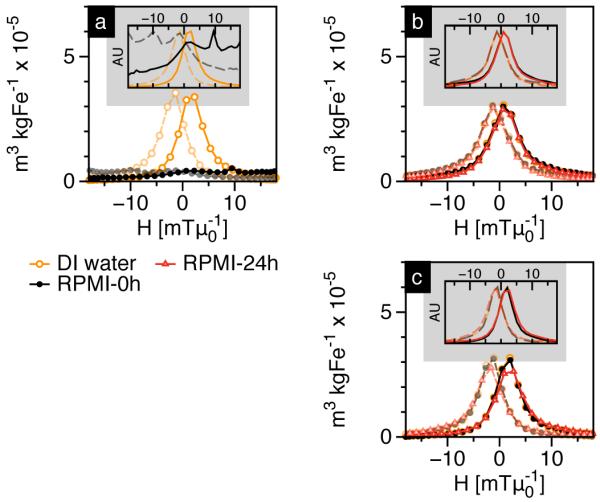
MPS measurements showing mass normalized m’(H) plots of SPIONs coated with (a) PMAO-5kPEG[20], (b) PMAO-5kPEG[30] and (c) PMAO-20kPEG[30], dispersed in 10% FBS-RPMI cell culture medium. Dashed lines indicate the m’(H) plot as the MPS drive field reverses direction. Insets show intensity normalized plots for clearer comparison of peak widths.