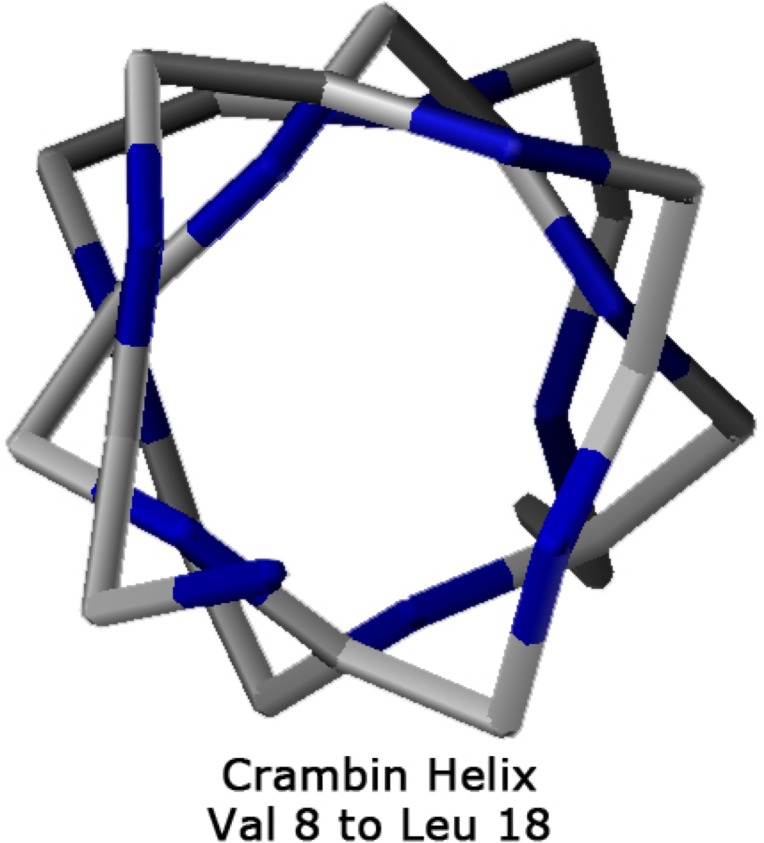
Fig 11. Helix 8–18 from the crambin crystal structure [PDB:1ejg], viewed from above the N-terminus.
The average φ value along the helix was between the experimental Némethy-, N- or 3.613/10-helix and the α-helix. However, the average ψ value was between the experimental 3.613/10-helix and a 310-helix.

