Figure 1.

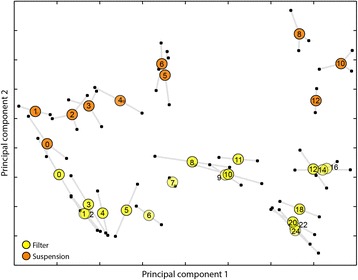
Uneven developmental progression is revealed by transcriptome time course trajectories. We developed cells on filters (yellow circles) and treated cells with cAMP in suspension (orange circles) in separate experiments. We analyzed the transcriptomes by RNA-sequencing and performed principal component analysis (PCA) to reduce the high dimensionality of the data. Both experiments were analyzed using 8,040 expressed genes intersecting the two data sets. For the filter time series, principal component 1 (PC1) and PC2 accounted for 28.6% and 19.6% of the variation, respectively. For the suspension experiment, PC1 and PC2 encompassed 31.2% and 17.3% of the variation, respectively. Plotting the second principal component (PC) (vertical axis) versus the first PC (horizontal axis) illustrates the prevailing patterns in transcriptional progression. The filter series contains two replicates of 19 time points. The suspension series contains two replicates with 10 time points and a third replicate with 9 time points (missing hour 12). For every time point we projected each sample transcriptome as a small black circle connected by whiskers to the other replicate(s). Large colored circles are placed at the center of the transcriptome projection replicates. The axes units are arbitrary.
