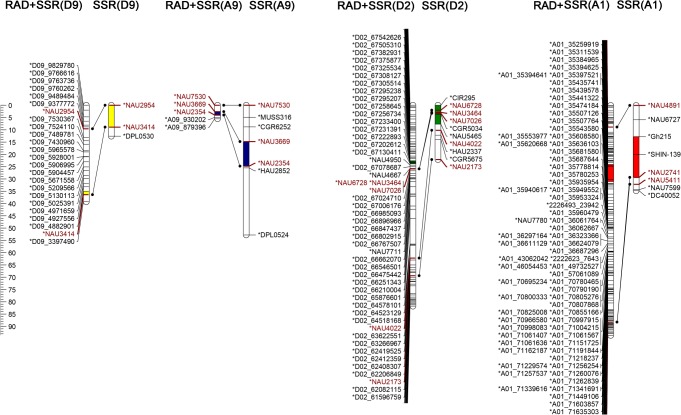
Fig 3. QTLs for VW resistance in two maps.
Four QTLs for VW resistance, qVW-D9-1, qVW-A9-1, qVW-D2-1, qVW-A1-1 were identified on both maps, with different colors indicating different 2-LOD intervals for each QTL. Maps were constructed with RAD markers plus SSR markers, and with SSR markers alone. Lines connecting the same markers in these two maps correlated the trait: these markers are colored brown.

