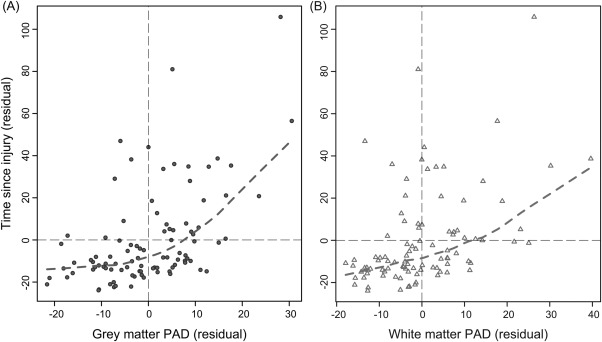
Figure 6.

Gray matter and white matter predicted age difference (PAD) score increases with greater time since injury (TSI). Scatterplots depicting the relationship between PAD score (x-axis) and TSI (y-axis) are shown. Plotted values are the residuals derived from a linear regression with PAD score or TSI, regressing out chronological age. (A) Gray matter (dark gray circles) PAD scores, with dashed lines representing the locally weighted scatterplot smoothing (lowess) line calculated (dashed gray line). B) White matter (light gray triangles) PAD scores with lowess line (dashed light gray line). Both analyses were conducted after the removal of 3 outliers, identified based on having a TSI of ±2 standard deviations from the mean.
