
Figure 5.
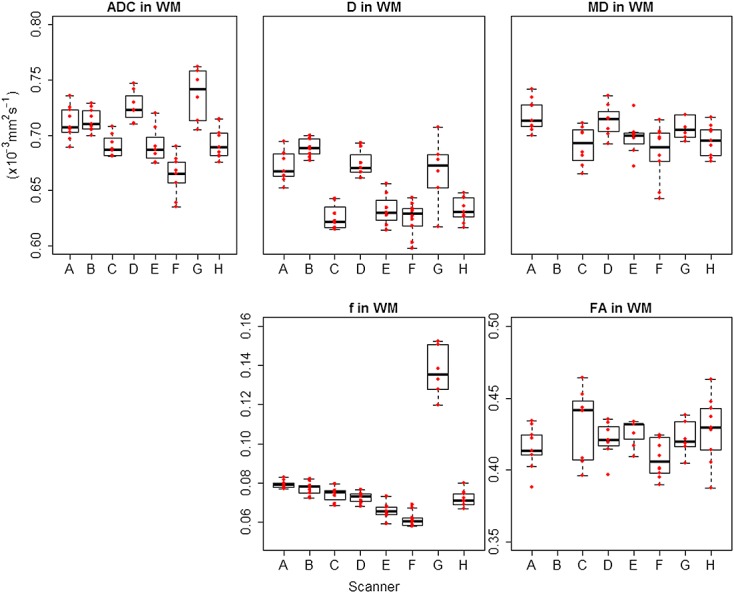
Box plots for DWI and DTI parameters across all scanners in white matter (WM). ADC, D and MD are shown with the same range on the y-axis for direct comparison. A–H represent each scanner involved in the study, and the red data points represent individual subjects. ADC and MD had very similar values, while D had comparable but lower values. The boxplots confirm the higher values of f in scanner G.