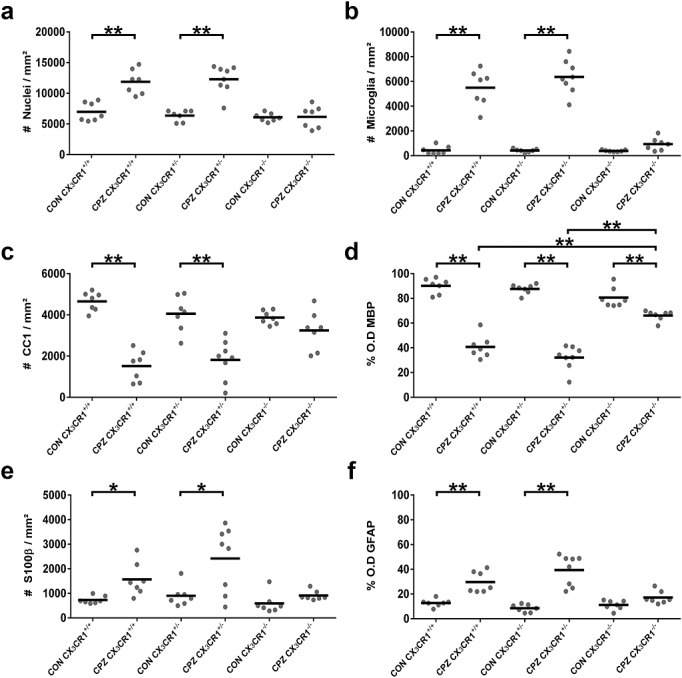
Figure 2.

Quantitative analysis of the immunofluorescence images. Dot-plot charts indicate within the delineated splenium and per mouse analyzed (a) total nuclei/mm2, (b) IBA1+ microglia/mm2, (c) CC1+ oligodendrocytes/mm2, (d) % MBP+ myelination status as determined by O.D., (e) S100β+ astrocytes/mm2 and (f) % GFAP+ astrogliosis as determined by O.D. (*p < 0.05; **p < 0.0001).
