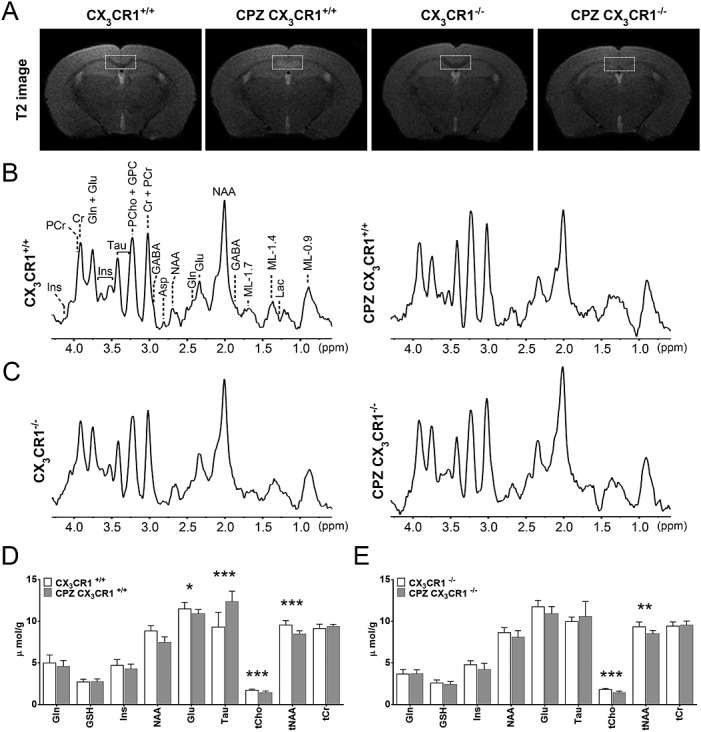
Figure 3.

1H-MRS analysis of control and CPZ-treated CX3CR1+/+ and CX3CR1−/− mice. (A) Representative T2 images showing edema, inflammation and demyelination in CPZ-treated CX3CR1+/+ mice but only demyelination in CPZ-treated CX3CR1−/− mice. The thin white dashed boxes indicate the placement of the 1H-MRS VOI. (B), (C) 1H-MRS spectra of control and CPZ-treated CX3CR1+/+ and CX3CR1−/− mice respectively. (D), (E) Bar charts showing the quantification of the different metabolites as seen in the 1H-MRS spectra of control and CPZ-treated CX3CR1+/+ and CX3CR1−/− mice respectively (shown in µmol/g ± SD, *p < 0.05 and **p < 0.01 and *** p < 0.001).
