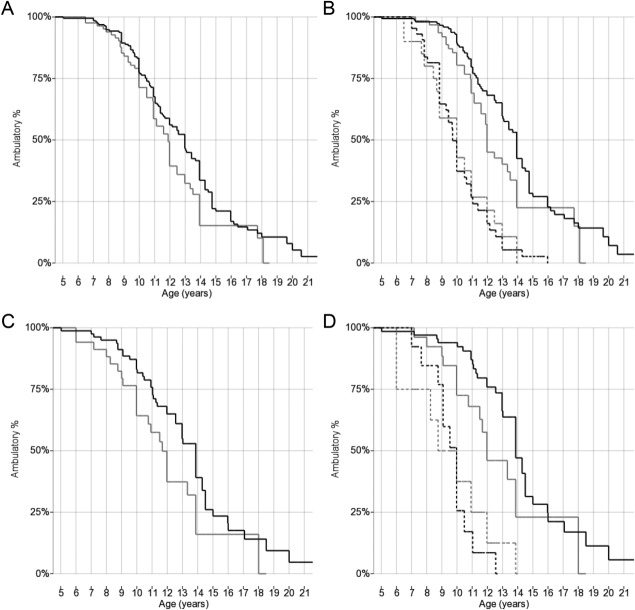
Figure 2.
Kaplan–Meier plots of age at loss of ambulation grouped by SPP1 rs28357094 genotype. (A) All patients genotyped for SPP1 rs28357094, including all races and ethnicities (n = 279), grouped 2 ways by rs28357094 genotype (black line = TT; gray line = TG/GG). (B) All patients genotyped for SPP1 rs28357094, including all races and ethnicities (n = 279), grouped 4 ways by rs28357094 genotype (black lines = TT; gray lines = TG/GG) and GC treatment (continuous lines = at least 1 year while ambulatory; dashed lines = <1 year or untreated). (C) Caucasian cohort controlled for population stratification and genotyped for SPP1 rs28357094 (n = 116), grouped 2 ways by rs28357094 genotype (black line = TT; gray line = TG/GG). (D) Caucasian cohort controlled for population stratification and genotyped for SPP1 rs28357094 (n = 116), grouped 4 ways by rs28357094 genotype (black lines = TT; gray lines = TG/GG) and GC treatment (continuous lines = at least 1 year while ambulatory; dashed lines = <1 year or untreated).

