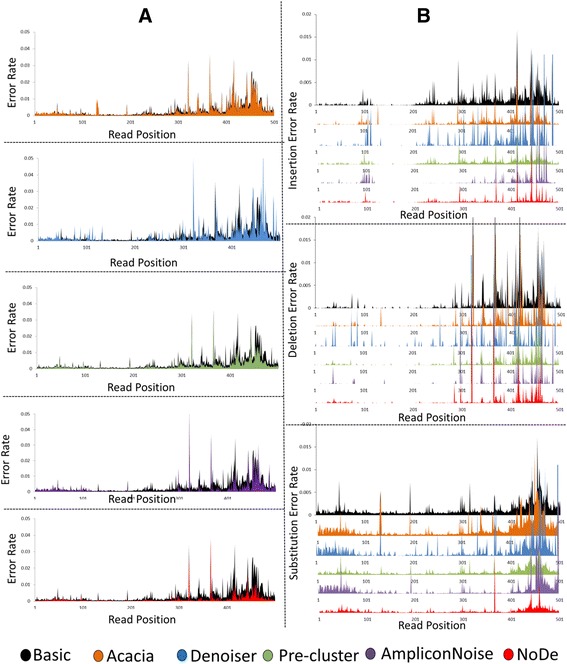
Figure 1.

Effect of denoising algorithms with respect to position in read. A) Plot showing the error rate versus the position in the read after being treated with different denoising algorithms, including: Acacia (orange), Denoiser (blue), SLP (Green), AmpliconNoise (violet) and NoDe (red), with the raw error rate in black. B) Plots showing the insertion (upper), deletion (middle) and substitution (lower) error rates produced in the raw reads (black), as well as after being treated by different approaches, versus the position in the read.
