
Figure 3.
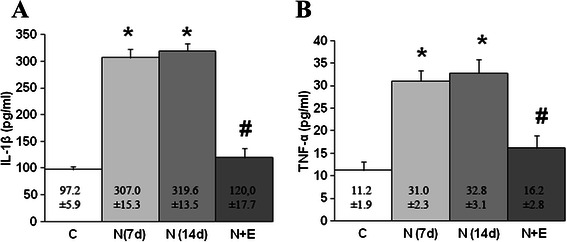
Plasma levels of IL-1β (A) and TNF-α (B) in control (C), Notexin (N7d, N14 d) and Notexin + EPI (N + E) groups. Values were measured by ELISA assay as indicated in methods. Data are mean ± SD of six independent experiments. *p < 0.05 vs control group; # p < 0.05 vs both Notexin groups.