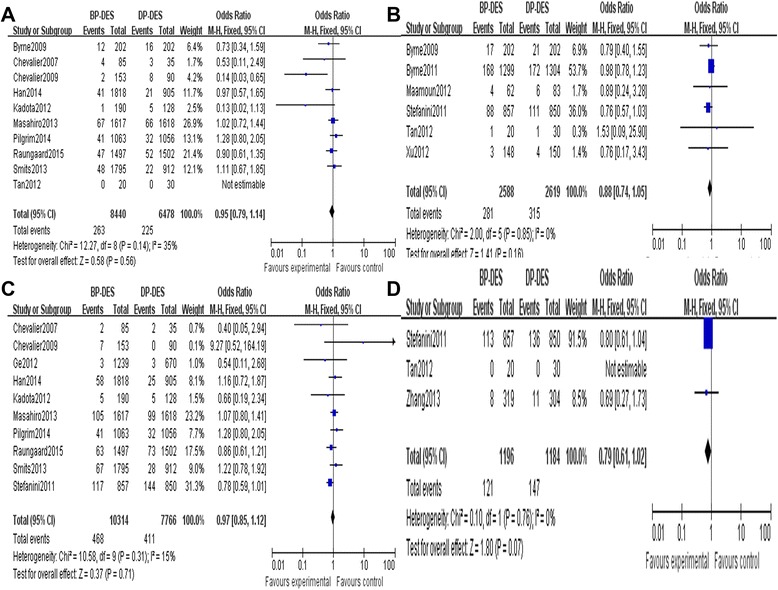
Figure 3.

General trend of the rates of TVR and TLR of DP-DES. (A) The TLR forest plot for patients with coronary artery heart disease who received a BP-DES or a DP-DES during 1 year. (B) The TLR forest plot for patients with coronary artery heart disease who received a BP-DES or a DP-DES more than 1 year. (C) The TVR forest plot for patients with coronary artery heart disease who received a BP-DES or a DP-DES during 1 year. (D) The TVR forest plot for patients with coronary artery heart disease who received a BP-DES or a DP-DES more than 1 year.
