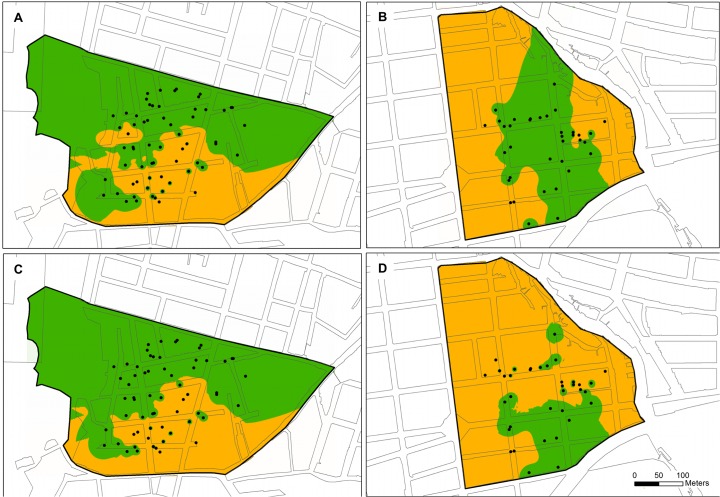
Fig 6. IWD interpolation analysis of group 1 (A, B) and group 2 (C, D) of Ae. aegypti in neighborhoods of Cumbre (A, C) and Granjas (B, D) of Bello (BE) city.
Green area indicates the classes of search for 0 individuals (absence), and orange areas for 1 or more individuals (presence) in each group. Black circles represent evaluated houses for Ae. aegypti.

