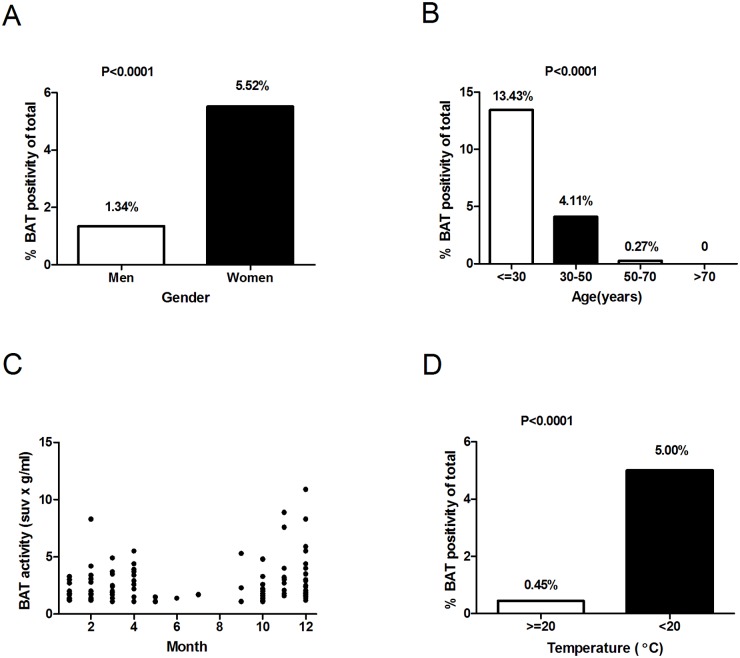
Fig 1. Correlation between the prevalence of badipose tissue and temperature, age and gender.
Panel A shows the prevalence of detectable BAT in men and women. Panel B shows the percentage of patients in different age ranges that had detectable BAT. In panel C, for the patients with detectable BAT, the activity of BAT in grams times the mean standardized uptake value (SUV) in grams per milliliter was shown in each month during a 3 year period from May 2007-Feb 2010. In Panel D, outdoor temperatures in Shanghai for the dates of scans were obtained and the percentage of subjects with detectable BAT in different temperature ranges was determined. A univariate analysis was used to assess the significance of differences in the percentages with the use of a chi-square test.

