
Fig 3. The prevalence of brown adipose tissue was nversely related with metabolic parameters.
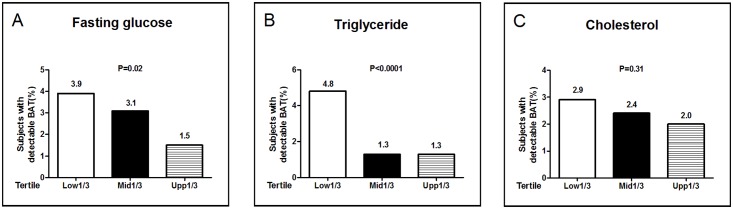
Fasting plasma glucose (Panel A), triglycerides (Panel B) and total cholesterol (Panel C) levels were divided into thirds. The percentage of patients in each subgroup who had detectable BAT was shown, and the P values for trend were calculated by using Mantel-Haenszel Chi-Square test.