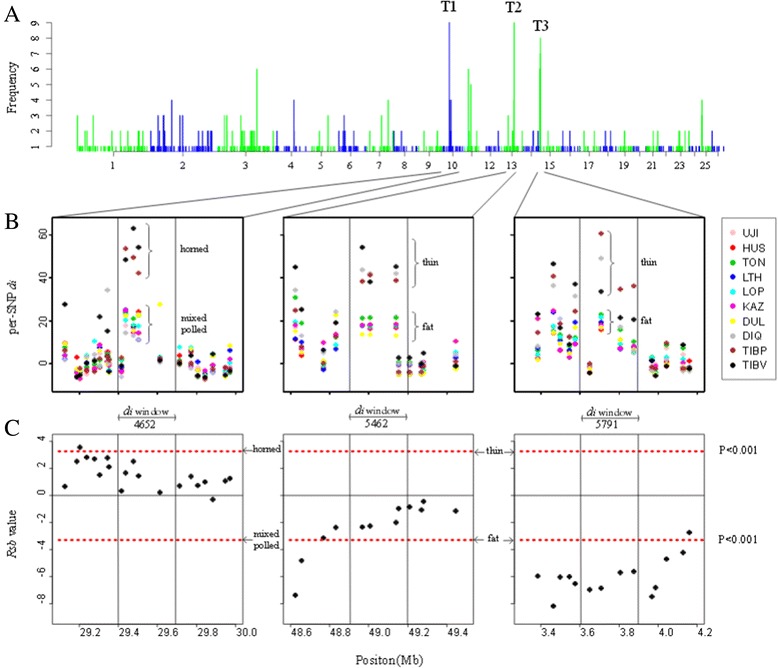
Figure 4.

Top 3 strongly selection regions in Chinese indigenous sheep. (A) The number of overlapping signatures of selection in each 300-bp window. We defined an overlapping signature of selection for each window if the empirical P value was ≤ 0.01 in one breed. The black arrow indicates the chromosomal region shown in B and C; (B) The per-SNP d i statistic of three regions with three consecutive windows, with T1, T2 and T3 widows in the middle. The braces indicate the group to which the breed belongs; (C) The Rsb value of each SNP in the three regions, which are consistent with B. The black arrow indicates the group name. The dashed red line denotes the significance threshold at P = 0.001.
