Figure 6.

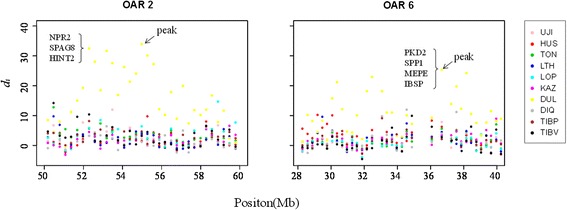
Plot of d i windows of two regions on OAR2 (50–60 Mb) and OAR6 (28.2–42 Mb) of 10 Chinese indigenous sheep breeds. A black arrow indicates the peak windows in each region. The braces include the candidate genes.

Plot of d i windows of two regions on OAR2 (50–60 Mb) and OAR6 (28.2–42 Mb) of 10 Chinese indigenous sheep breeds. A black arrow indicates the peak windows in each region. The braces include the candidate genes.