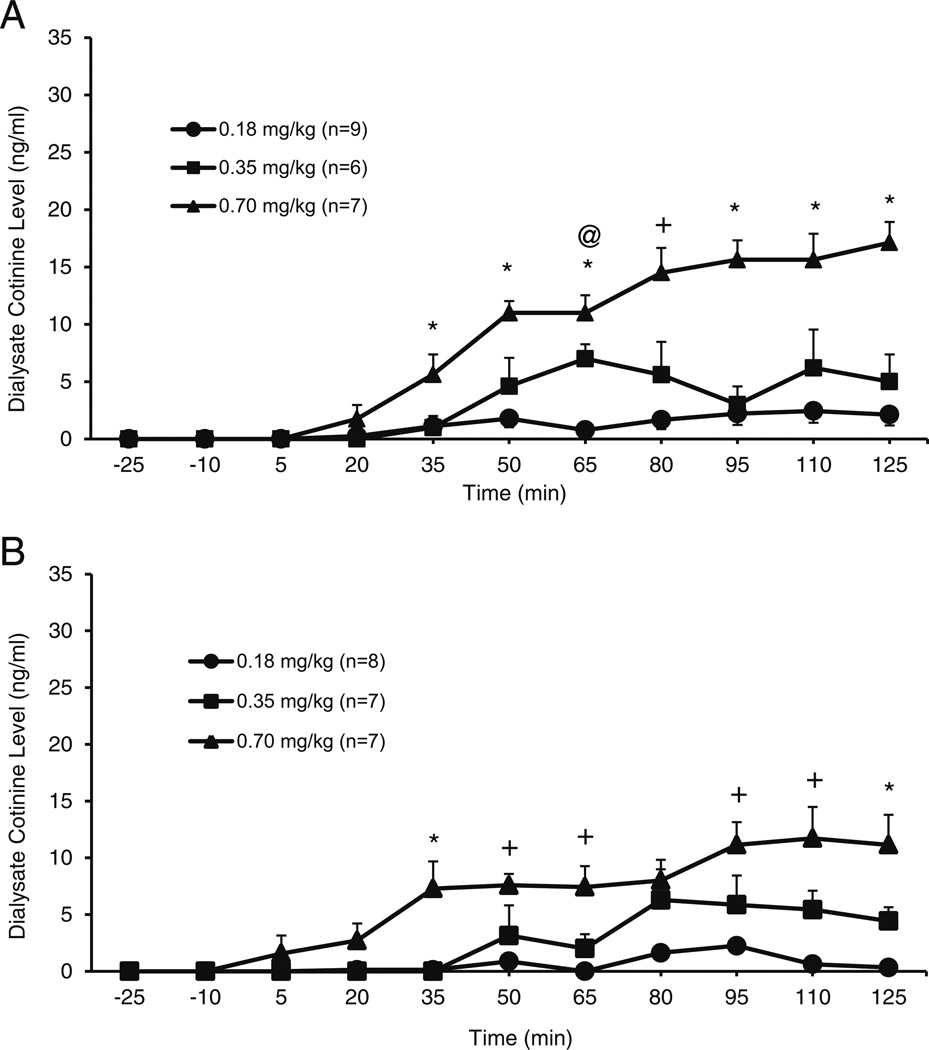
Fig. 2.
Mean (±SEM) concentrations of cotinine (ng/ml) in the NACsh of P (a) andWistar (b) rats following subcutaneous (−)nicotine administration (0.18, 0.35, and 0.70 mg/kg). For P rats (a), the two-way ANOVA revealed a main effect of time (F8,17 = 13.4; p < 0.001), a time × dose interaction (F16,32 = 5.6; p < 0.001), and a main effect of dose (F2,24= 43.9; p < 0.001). The follow-up one-way ANOVAs showed significant effects of dose after nicotine administration for P rats (F > 4.7; p < 0.05; at each time point). For Wistar rats, the two-way analysis revealed a main effect of time (F8,12 = 10.0; p < 0.001), a time × dose interaction (F16,22= 3.4; p < 0.005), and a main effect of dose (F2,19 = 7.4; p < 0.002) on cotinine concentrations. The follow-up one-way ANOVAs showed significant effects of dose after nicotine administration for Wistar rats (F > 7.1; p < 0.05; at each time point up to 95 min). Post hoc tests revealed that from the 35-min time point on, the 0.7 mg/kg dose was significantly different from at least one of the other doses for both strains at almost every time point (up to 125 min postadministration; p < 0.05). * = 0.7 different from 0.18 and 0.35 mg/kg doses; + = 0.7 significantly different from 0.18 mg/kg; @ = 0.35 significantly different from 0.18 mg/kg; p < 0.05

