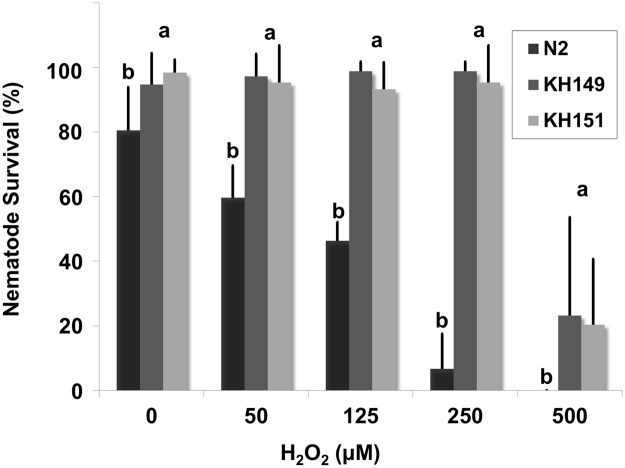
Fig 6. Survival percentage of wild-type (N2) and transgenic (KHA149 and KHA151) C. elegans after 24 hours exposition to H2O2 (H2O2 concentrations ranging between 0 and 500 μM).
Error bars represent standard deviation. Different letters above the columns indicate significant differences (p < 0.05) between C. elegans N2, KHA149 and KHA151 survival percentages in each H2O2 treatment, according to post-hoc Duncan’s test.

