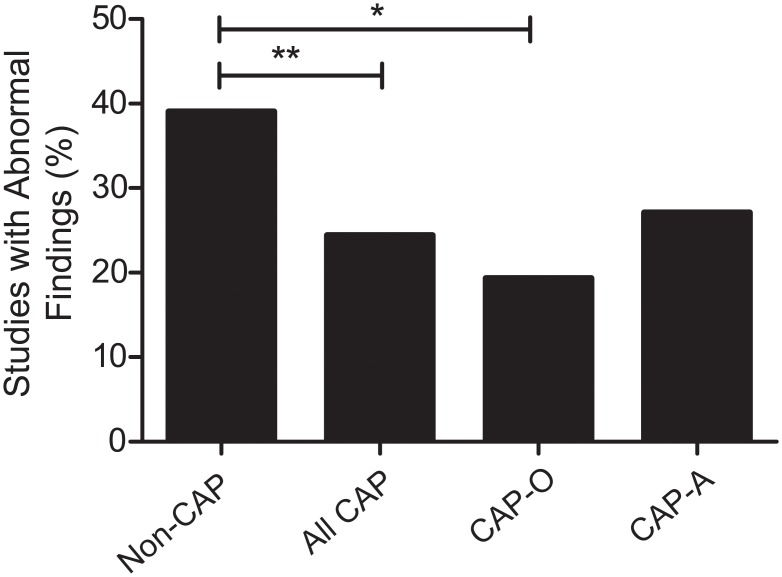
Fig 2. Abnormal findings in those receiving VCE for CAP versus those receiving VCE studies for all other indications (non-CAP).
CAP-O represents CAP with no other symptoms. CAP-A represents CAP and any associated symptoms (See Methods for description). * represents a p-value of < 0.05. ** represents a p-value of < 0.01

