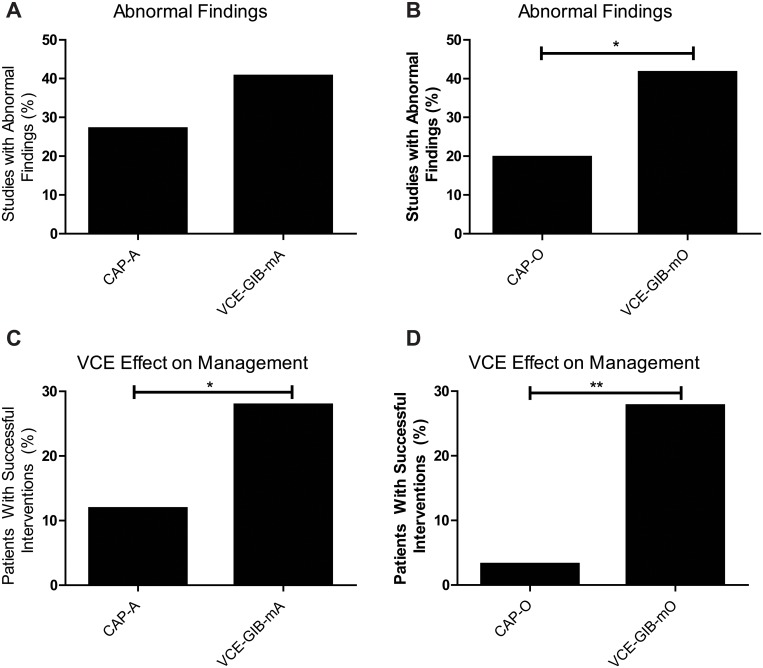
Fig 4. Sensitivity analysis with 2:1 age and gender matched control (CAP).
(A) Abnormal finding rates in patients with CAP and no other symptoms compared to matched patients who were evaluated for gastrointestinal bleeding (B) Comparison of the clinical impact of VCE in the CAP-O cohort and its matched gastrointestinal bleed group. (C) Abnormal finding rates in patients with CAP and other symptoms compared to age and gender matched patients who were evaluated for gastrointestinal bleeding. (D) Comparison of the clinical impact of VCE in the CAP-A cohort and its matched gastrointestinal bleed group. * represents a p-value of < 0.05. ** represents a p-value of < 0.01

