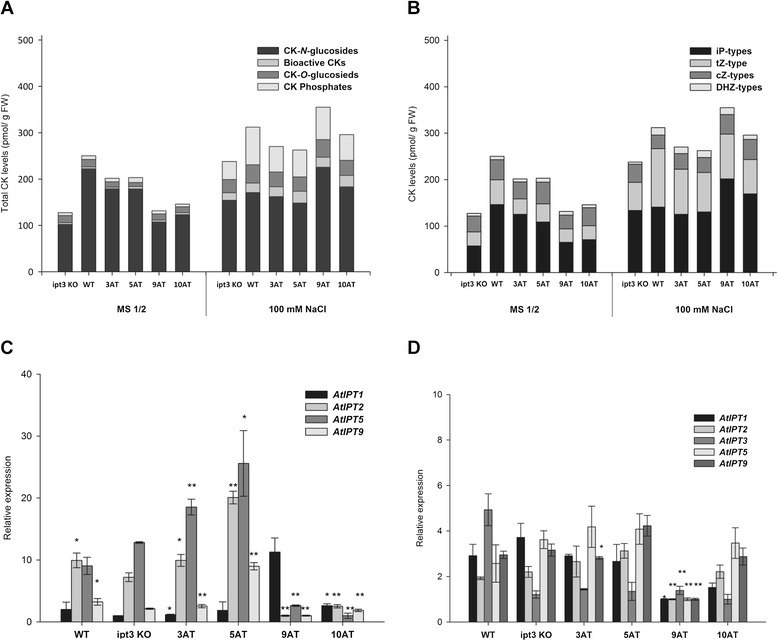
Figure 5.

CKs accumulation in Arabidopsis ipt3 complemented plants. Total endogenous CK levels of SlIPT4 (lines 3AT and 5AT) and SlIPT3 (lines 9AT and 10AT) ipt3 KO complemented plants divided according to the chemical structure (A) and contents of bioactive CKs (B). Relative expression of CK biosynthetic genes in Arabidopsis ipt3 KO mutants complemented plants cultivated on the control medium (C) and on the salt-containing (100 mM NaCl) medium (D). Actin and EF1 were used as internal controls for normalization of AtIPT transcript levels. Data represent means and SD of two replicates. *statistically significant difference from ipt3 KO (unpaired two-tailed Student’s t-test, p ≤ 0.05). **statistically significant difference from ipt3 KO after Šidák correction for testing of multiple lines (multiple unpaired two-tailed Student’s t-test, overall α = 0.05, individual p ≤ 0.01).
