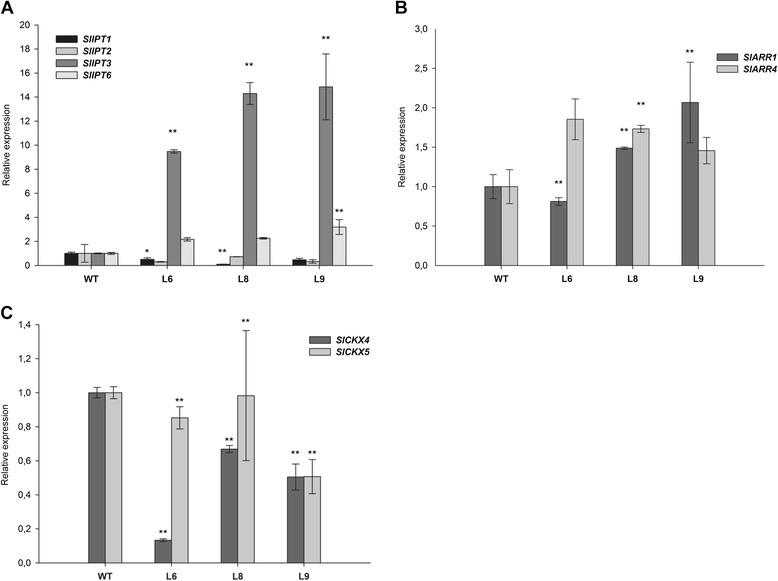
Figure 7.

Relative expression of CK metabolic and response genes in tomato young leaves of 35S::SlIPT3 and WT plants. Transcript abundance of CK biosynthetic genes (A), genes involved in CK signaling (B) and degradation (C) pathways. Actin and GAPDH were used as internal controls for normalization of candidate genes expression. Data represent means and SD of two replicates. *statistically significant difference from WT (unpaired two-tailed Student’s t-test, p ≤ 0.05). **statistically significant difference from WT after Šidák correction for testing of multiple lines (multiple unpaired two-tailed Student’s t-test, overall α = 0.05, individual p ≤ 0.017).
