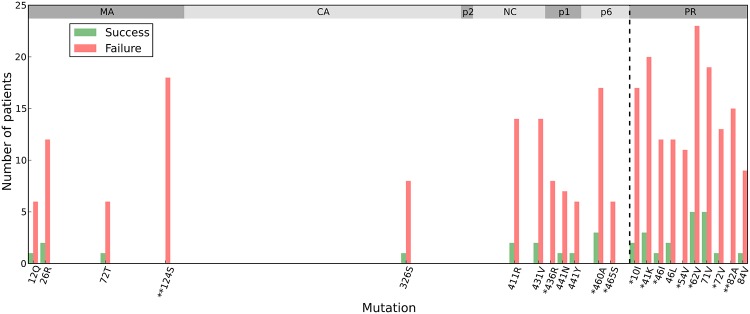
Fig 3. Mutations that are contribute to therapy failure.

Bar charts showing the number of patients in which specific mutations occur during PI-based regimens including indinavir (IDV), saquinavir (SQV), and nelfinavir (NFV). Shown are the mutations with the largest differences between the successfully and unsuccessfully treated patient populations. Patients who failed therapy are shown in red and patients who had successful therapy are shown in green. The percentage above each bar denotes the percentage of all patients treated with that regimen which experience that mutation. Mutations with a */** are found to be statistically significant after Holm-Bonferroni correction with family-wise error rates 0.1 and 0.01 respectively among 140 mutations.
