
Figure 4.
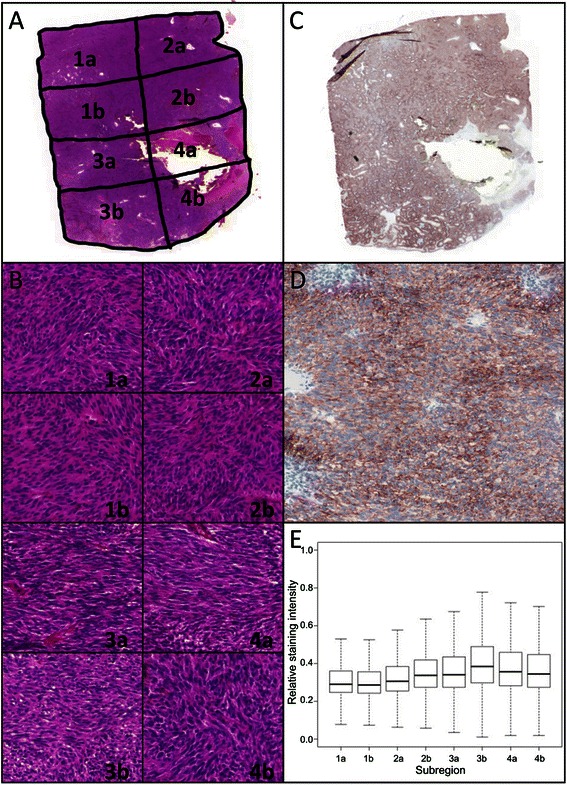
Histological characteristics of subregions of case 7. (A) Overview of segmented H&E stain (magnification 10x). (B) H&E stain of each subregion (magnification 200x). (C) Overview of CD117 stain (magnification 10x). (D) 200x magnification of subregion 2b. (E) Quantitative immunohistochemistry. Image analysis of 1.85 mm2 per subregions. Shown are the median, the 95% confidence interval and the standard deviation.