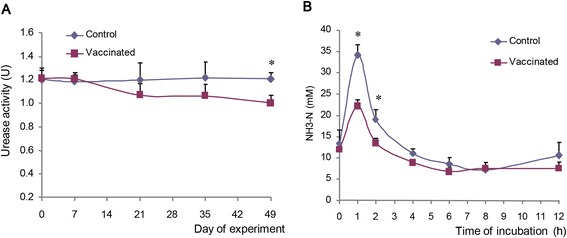
Figure 4.

Urease activity in the rumen after immunization (A) and ammonia concentration variation after urea was infused into the rumen (B). Values are means (n = 4), with error bars representing standard deviation. The asterisks (*) indicate significant (P < 0.05) difference between the control group and the vaccinated group at the time points.
