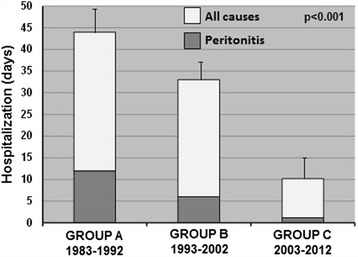
Figure 5.

Days of hospitalization in the three study periods. The histograms represent the mean ± SD of the days of hospitalization for all causes (white bars) and peritonitis (gray bars) in each study group. Group A: 1983–1992; Group B: 1993–2002; Group C: 2003–2012.
