
Figure 2.
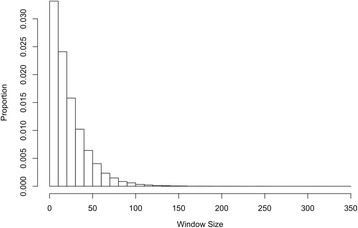
Window sizes. Histogram of the variability in window sizes, shown according to number of markers included per window, obtained by applying the spline window method to previously published maize data [5].
Official websites use .gov
A
.gov website belongs to an official
government organization in the United States.
Secure .gov websites use HTTPS
A lock (
) or https:// means you've safely
connected to the .gov website. Share sensitive
information only on official, secure websites.
Window sizes. Histogram of the variability in window sizes, shown according to number of markers included per window, obtained by applying the spline window method to previously published maize data [5].