
Figure 5.
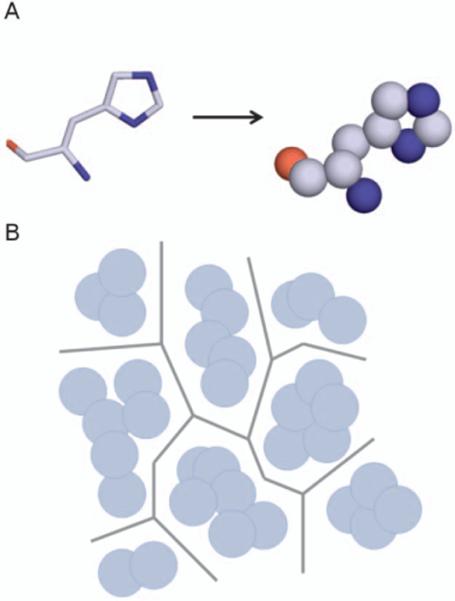
Implementation of Voronoi diagrams in tunnel prediction. A) First atoms of protein residues are converted into spheres based on the van der Walls radii of the atoms. B) Voronoi edges are plotted as to maximize the distance between adjacent spheres. Series of edges represent potential tunnels in the structure. Methods such as Dijkstra's algorithm can then be used to identify connected edges that result in the shortest paths from binding site to bulk solvent.