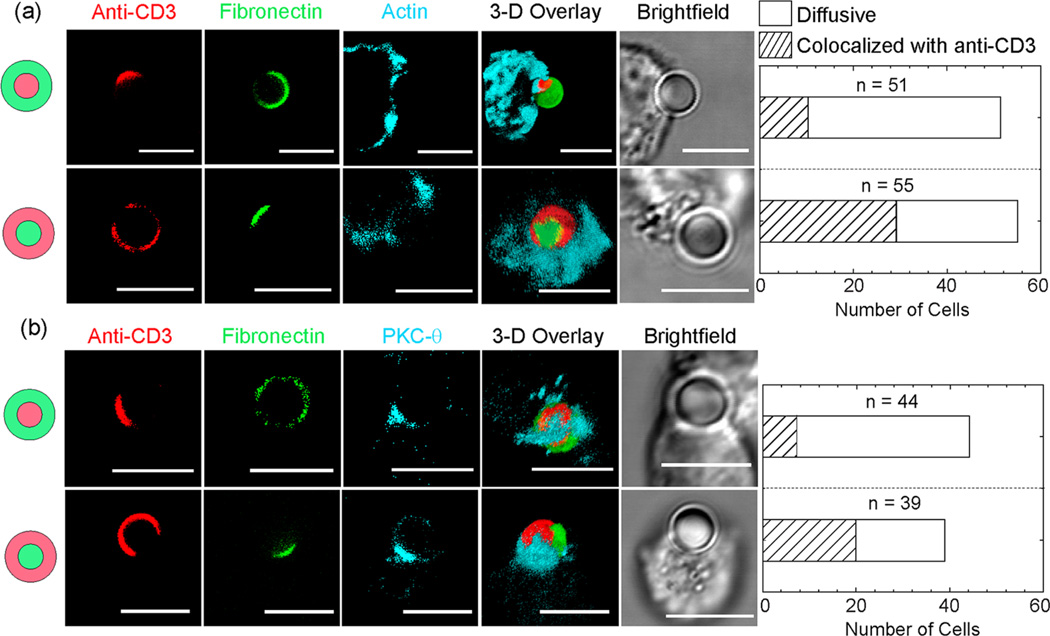
Figure 3.
Fluorescence confocal images show different intracellular clustering morphologies of (a) actin and (b) protein kinase C (PKC)-θ in T cells that are stimulated by “bull’s eye” particles. Actin and PKC-θ either colocalize with the anti-CD3 patch or appear diffusive over the entire particle–cell contact area. Bar graphs show the total number of cells for each category. Scale bars: 5 µm.

