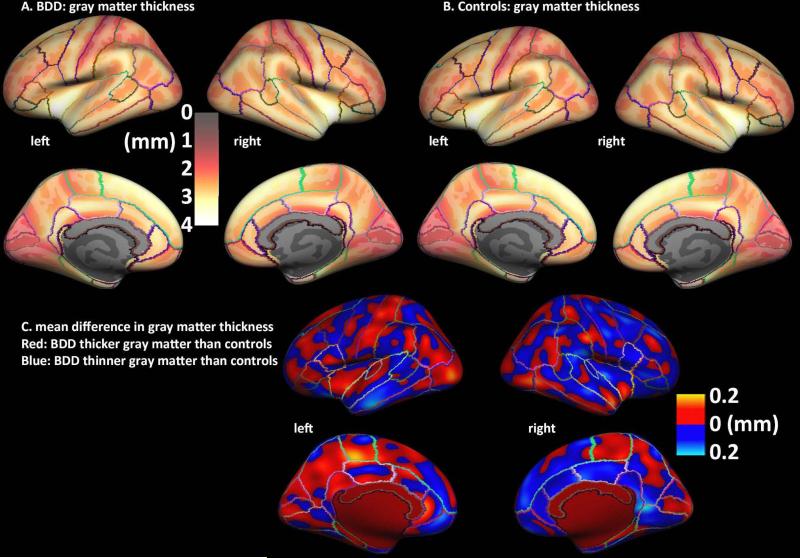
Fig. 1. Cortical thickness in body dysmorphic disorder (BDD) and healthy control participants.
A, B. Maps of average normalized gray matter thickness (mm) at each surface vertex for BDD (A) and healthy control groups (B). Lighter, yellow colors indicate thicker gray matter; darker, red colors indicate thinner gray matter.
C. Map of normalized differences in gray matter thickness for BDD vs. healthy controls. There were no significant differences between groups.

